Quantitative Reasoning

The quantitative reasoning section of the UCAT tests your arithmetic skills 

  • Some questions are standalone while some are connected to the same data 

  • There is an on-screen calculator present to help with this section 

  • When practising for this section it is better to use a desktop computer with a number pad and a mouse to accurately mimic the UCAT test environment 

  • Most of the questions have a chart or graph with data 

  • Question types include:

    • Percentage changes and decimal equivalents 

    • Unit conversion - weight, currency exchange, time and temperature 

    • Rates - rates for flow

    • Speed questions 

    • Averages- mean median mode 

      Please note some images on mobile might be difficult to read.

Four colorful calculator buttons with mathematical symbols: plus, percentage, multiplication, and equal signs.

The UCAT calculator 

  • Pressing the backspace or  ON/C button on the calculator deletes all the numbers on the calculator 

  • To store numbers on the calculator use the M+ button 

  • To recall stored numbers use the MRC button 

  • To delete stored numbers use the M- button 

Image of a Texas Instruments TI-108 calculator showing a zero on the display.

Exploring question types

Percentage changes and decimal equivalents 

You might be asked to calculate a change in percentage. To do so use the following formula:

Percentage change = (Final Value - Original Value) / Original Value

Table showing household waste in kilograms per person per year over nine years, with two rows: waste not recycled and waste recycled. Waste not recycled decreases from 394 kg in Year 1 to 376 kg in Year 9. Waste recycled increases from 3 kg in Year 1 to 135 kg in Year 9.

Unit conversion - weight, currency exchange, time and temperature 

This type of question can take some time to answer due to the conversions therefore if you find yourself spending a lot of time on questions like this make an educated guess, flag and skip so you have time for some easier questions

A multiple-choice science question about balloon flights and temperature conversion, with options A through E.

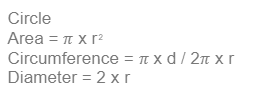
Shapes - Volume, Area and Perimeter 

For this type of question it is important to be aware of formulas to calculate volumes, areas and perimeters for common shapes. We have attached them all further down in the page.

Diagrams of three rectangular flower beds labeled I, II, and III, with measurements. Flower Bed I is 3 meters wide and 4 meters long. Flower Bed II is 8 meters wide and 10 meters long. Flower Bed III is 13 meters wide and 16 meters long. The beds are aligned on the left and bottom sides.

Tax

Calculating tax can be really confusing because of the tax brackets so it’s important to do a lot of practice questions to get yourself used to it. 

For this question type you will always be provided with tax bracket data so don’t spend any time to commit this data to memory.

Table showing tax brackets, tax rates, and total tax paid at the top of each bracket for annual taxable income. The brackets are $0 to $8,950 at 10%, $8,950 to $36,250 at 15%, $36,250 to $87,850 at 25%, $87,850 to $183,250 at 28%, $183,250 to $400,000 at 33%, and over $400,000 at 39.6%.

Speed

You might be asked to solve speed related questions.

Ensure you have a good understanding of velocity/time graphs and acceleration/time graphs.

Graph showing the velocity vs. time for two cars, Car A and Car B. Car A's velocity increases from 0 to 16 m/s in 4 seconds, while Car B's velocity remains constant at 8 m/s. Car A is depicted as a car icon near the top right of the graph, and Car B as a car icon near the middle right of the graph.
Multiple choice question with options for different values of acceleration due to gravity, ranging from 4 to 16 meters per second squared.

Averages - Mean, Median & Mode 

Mean = Total of all numbers Amount of numbers

  • Median = The middle value when the numbers are in order, if two numbers are in the middle take the average

  • Mode = The value which appears the most 

  • Range = Largest value - the smallest value 

  • For example: 3,3,5,6,7,7,8,9

    • Mean -  (3+3+5+6+7+7+8+9) / 8= 6

    • Median - (6+7) / 2= 6.5

    • Mode - 3 and 7 

    • Range - 6

A black and white grid graph showing the number of employees using four different services over three quarters. Service A has a few employees each quarter, Service B has about 30-35 employees, Service C fluctuates around 10, and Service D has fewer than 10 employees. Multiple-choice question below asking for the median number of employees for Service A over the three quarters, with options: 6, 7, 20, 30, 35.

Quantitative Reasoning Top Tips

  • Improve your mental math. You can do this by playing brain games like Elevate and Lumosity 

  • Do simple calculations in your head or use the notepad 

  • Don’t use the UCAT calculator for all your calculations it wastes time

  • Use your notepad to make notes of your workings in an organised way so you can easily go back to your workings if you go through the question again 

  • Memorise useful formulas and conversions 

  • Estimate especially when the answer options are very different from each other  

  • Make sure you understand compound interests and tax brackets 

  • Read the axes of the graph very carefully 

Click here to go back to the overview page. Scroll down for useful formulas, conversions and equations.

Illustration of a pencil writing on a sheet of paper.

Conversions, Formulas and Question Types

Conversions

A chart explaining measurement conversions for distance, mass, liquid volume, percentages, and minutes-to-hours, with icons representing each category.

Formulas

Empty square frame with a thin gray border
Text explaining the properties of a square, including its area formula (length x length) and perimeter formula (4 times length).
Diagram of a parallelogram with labeled height, width, and length.
Text explaining the formula for the perimeter of a parallelogram.
A diagram showing a circle with radius labeled r and diameter labeled d.
Text explaining the formulas for a circle's area, circumference, and diameter.
A simple diagram of a rectangle with labeled width (W) and length (L).
Text explaining the properties of a rectangle, including area and perimeter formulas.
An equilateral triangle with sides labeled a, b, and c, and a height labeled h.
Text explaining the properties of a triangle, including its area as half the base times height and the perimeter as the sum of sides a, b, and c.
Diagram of a trapezoid with labeled sides a, a2, b, and b2, and height h.
Mathematical formulas for the area and perimeter of a trapezium, showing the area formula as half the sum of the bases times height, and the perimeter as the sum of all four sides.

Equations

Speed (m/s) = Distance (m) / Time (s)

Percentage change = (Final Value - Original Value) / Original Value

Mean = Total of all numbers / Amount of numbers